Blog· November 9, 2026
How to score yard and landscape upkeep across a portfolio without a site visit
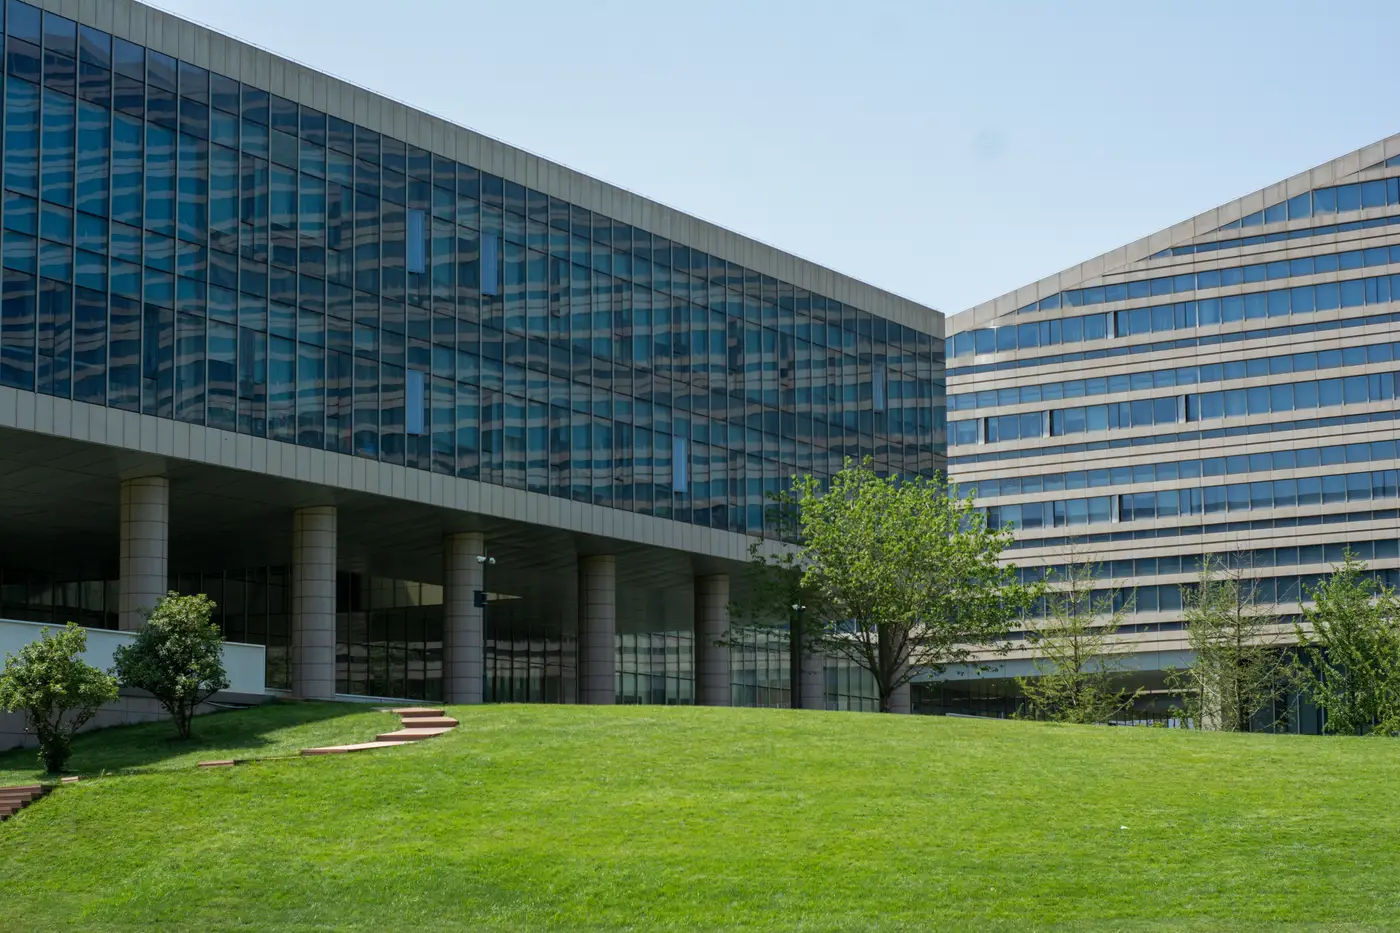
Grounds upkeep is the line item nobody flags until a tenant walks a site and mentions the dead turf out front, or a broker doing a tour trips on a heaved paver. By then it's already cost you something: a renewal conversation, a leasing impression, a complaint that lands on the asset manager's desk instead of the grounds crew's.
Most portfolios still score landscape condition the way they always have. A regional manager drives the route twice a year and jots notes on a clipboard or a phone. A property manager fills out a self-reported checklist that may or may not match what's happening on the ground. Neither scales past about 30 sites before the data gets thin, stale, or just inconsistent between whoever's doing the looking.
Why the usual methods fall apart at scale
Windshield surveys depend on who's driving and how much daylight they have left. A regional manager covering 60 sites across three states isn't going to walk every parking lot island and every side yard. They're going to glance at the front entrance, note anything obviously bad, and move on. That's fine for catching a collapsed fence line. It misses the slow stuff: turf thinning out behind a building where nobody walks, a mulch bed that's gone to weeds because the vendor skipped two cycles, overgrowth creeping toward a loading dock that nobody's filed a work order on yet.
Self-reported checklists have the opposite problem. The property manager filling it out has every incentive to mark things fine, because a bad score means a conversation about why the landscaping vendor isn't performing. Neither method gives capital planning a number you can rank sites against with any confidence, and neither one happens on the same calendar across every property, so comparing site A to site B means comparing a checklist from March to a drive-by from September.
What an annual remote pass catches
A very high resolution pass, 0.3 meter or finer, run once a year across the whole portfolio, picks up what both of those methods struggle with precisely because it doesn't depend on someone's attention that day. Turf condition and dead zones show up as color and texture differences you can flag consistently site to site. Overgrowth encroaching on a structure, a fence line, or a drainage path reads the same way regardless of which region it's in. Parking lot cracking and striping wear, which usually gets noticed only when it's bad enough for a tenant to mention it, shows up on the same pass as the yard condition, so a capex planner isn't stitching together two separate surveys to get a full picture of one site.
What it doesn't replace is someone walking the property and deciding whether a specific hedge needs trimming this week. That's still a grounds crew call. What it replaces is the annual guesswork of deciding which 15 sites out of 150 need a closer look before next year's capital budget gets locked.
Building a score you can rank against
The output you want is a number or a flag per site, something that lets you sort a portfolio the way you'd sort a spreadsheet: worst condition first. Roof wear, lot cracking, and yard upkeep each get their own flag, because a site with a fine roof and a rough yard needs a different line item than one with both problems. That ranked list is what goes into the capital plan review, not a folder of site-visit PDFs someone has to open one at a time to find the sites that need budget.
Asset Condition Review runs that pass once a year and hands back a ranked list and a map layer built for exactly this, so your capital plan starts with a sorted problem list instead of a stack of drive-by notes.
If your next capital review is still waiting on someone to drive the portfolio, it might be worth seeing what a single annual pass turns up first.